MobSF "IPA Binary Analysis" | Step by Step

MobSF is an open source static and dynamic analysis tool for Android and iOS, which can be used to quickly detect major issues on your mobile application.
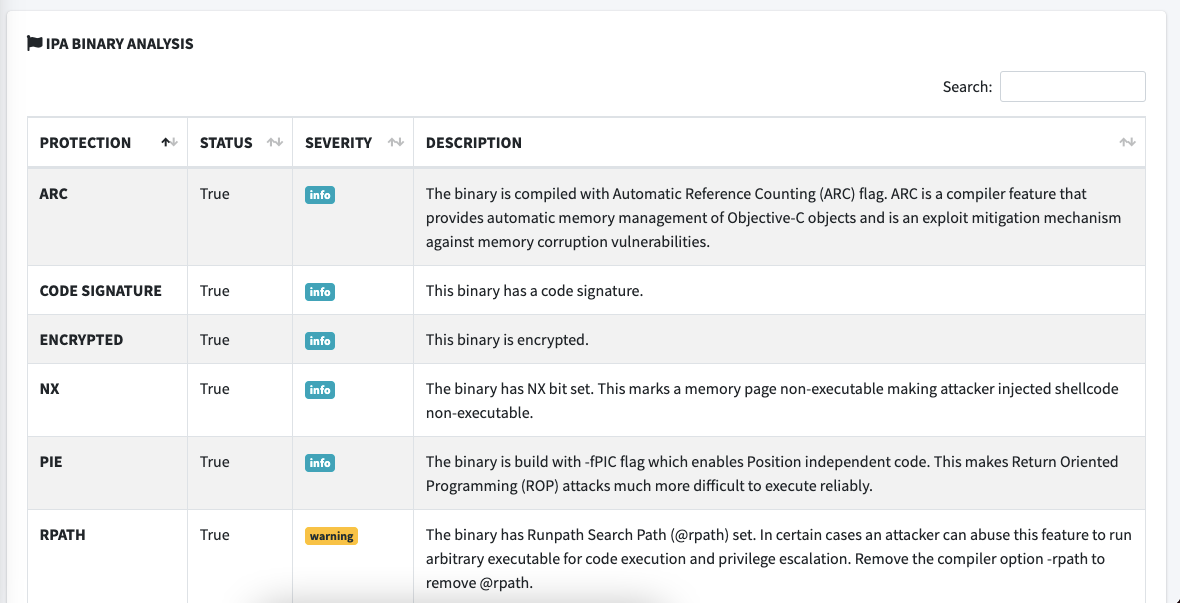
When scanning an .ipa, the "IPA Binary Analysis" section can report multiple issues that can be hard to interpret.
Hopefully this article will help you understand why each vulnerability was reported and how to fix it.
Getting to the good stuff
.ipa files are actually just zipped files that include the application executable and a bunch of other stuff.
When we talk about binary analysis, we're actually just talking about analysing this executable file, so the first thing we need to do is find it.
Note that if you don't have access to the .ipa you can extract it from the App Store using ipatool:
~ brew tap majd/repo
~ brew install ipatool
~ ipatool download --bundle-identifier <app-bundle-id> --email <appstore-account-email> --password <appstore-account-password>
So, now that you have your .ipa it's time to unzip it and look inside:
~ unzip MyApp.ipa
~ cd Payload/
~ cd MyApp.app/
~ file MyApp
MyApp: Mach-O 64-bit executable arm64
As you can see above, the app binary is compiled for ARM and uses the Mach-O file format.
A more thorough analysis of this binary can be done using otool. You should become familiar with this tool since it will help us validate and fix most of the issues reported below.
Alternatively, I also recommend htool, which serves the similar purpose of analysing Mach-O binaries.
ARC

If you're used to working with Swift, then you most likely know ARC or "Automatic Reference Counting" simply as one of the core features of the language.
However, ARC is actually a feature of the Clang compiler, and unlike with Swift, you can (but shouldn't) use Objective-C without using Automatic Reference Counting.
If you've never heard of "Automatic Reference Counting" you should basically know that it "automatically frees up the memory used by class instances when those instances are no longer needed".
The alternative is to leave memory management to the developer, who is always less reliable and can easily make mistakes that can lead to memory corruption vulnerabilities.
So, if your application is written (at least partially) in Objective-C, you should first make sure that the project is configured to use ARC by checking the "Objective-C Automatic Reference Counting" setting under the "Build Settings" tab:
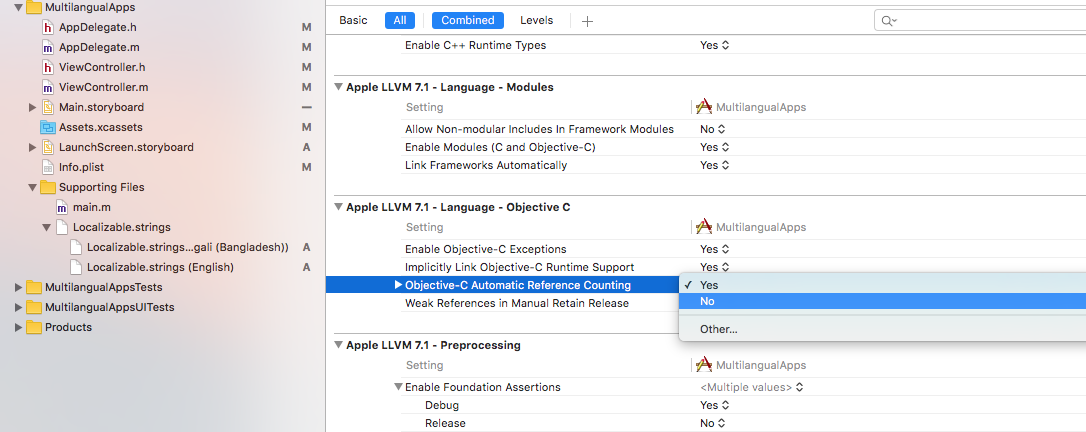
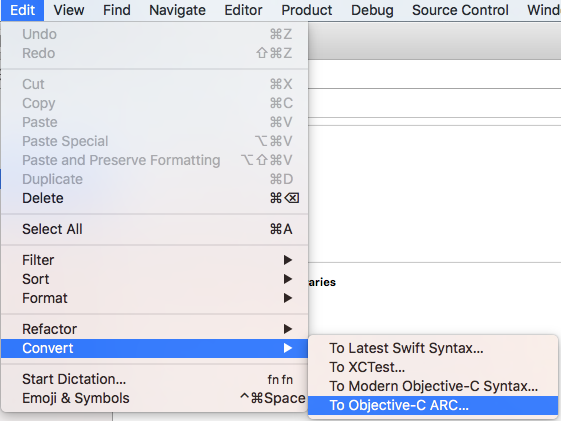
If this property is set to No, you should "Convert" the project, as shown below:
You can also check the "Compile Sources" section under the "Build Phases" tab for the presence of the -fno-objc-arc flag, which is used to exclude specific files from using ARC, as shown below:
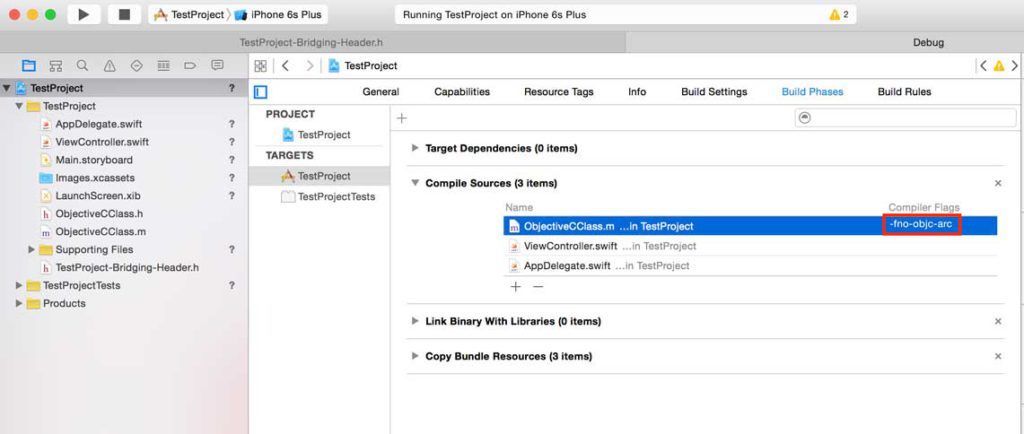
Since there are limitations that come with using ARC, the adequacy of these exceptions should be evaluated on a case by case basis.
As mentioned above, otool can help us understand our binary files a little better.
When it comes to ARC we can use this tool to check for the presence of ARC-related symbols, such as _objc_release, _objc_autorelease, _objc_storeStrong, _objc_retain, etc.:
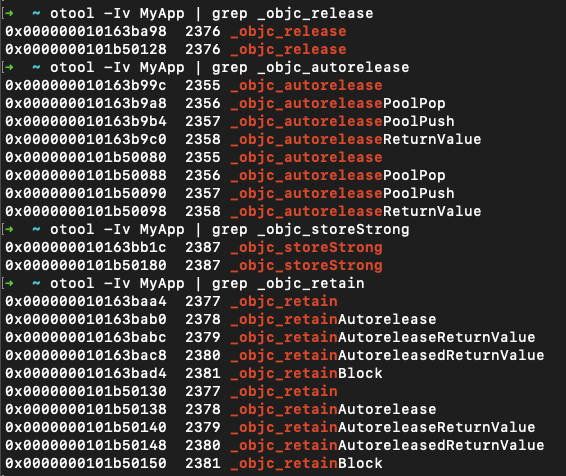
Note the usage of otool's -I and -v flags:
~ otool
	...
	-I print the indirect symbol table
	-v print verbosely (symbolically) when possible
Code Signature

From the Apple docs on Code Signing we can read:
Before your app can integrate app services, be installed on a device, or be submitted to the App Store, it must be signed with a certificate issued by Apple.
Also, from the iOS Security Guide:
In order to develop and install apps on iOS devices, developers must register with Apple and join the iOS Developer Program. The real-world identity of each developer, whether an individual or a business, is verified by Apple before their certificate is issued.
[...]
At runtime, code signature checks of all executable memory pages are made as they are loaded to ensure that an app has not been modified since it was installed or last updated.
So, code signing is simply the process of signing an application with an appropriate certificate that ensures the author's identity and the app content's integrity.
Since this process is required by Apple for most operations, if this section is flagged as "False" by MobSF, it's likely that the file you're analysing was generated via some non-traditional method, which seems worth investigating.
Encrypted

Similarly to the previous section, encryption shouldn't be a concern for most iOS developers, since the App Store takes care of it during the distribution process.
From iPhoneDev's Wiki:
App Store binaries are signed by both their developer and Apple. This encrypts the binary so that decryption keys are needed in order to make the binary readable.
So, when it comes to the MobSF analysis you should keep in mind the origin of the .ipa you're testing:
- if you simply download it from the
App Store(usingipatool, for example), then the binary should be encrypted; - if you get the
.ipafrom any other source, then most likely it's not encrypted.
To confirm the binary's encryption you can use otool to look for the LC_ENCRYPTION_INFO section:
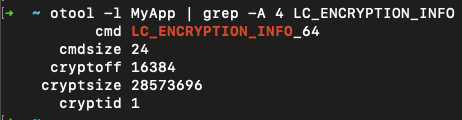
From the iPhoneDev Wiki:
iOS can tell the encryption status of a binary via thecryptidstruture member ofLC_ENCRYPTION_INFOMachOloadcommand.
Ifcryptidis a non-zero value then the binary in encrypted.
Note that the cryptsize indicates the size of the encrypted segment.
Also note the usage of otool's -l flag:
~ otool
	...
	-l print the load commands
NX

Although the NX bit is specific to the AMD architecture, people tend to use "NX" as a generic way of referring to the feature that enables you to specify non-executable memory pages.
So, in this case, the NX section actually refers to the XN or "eXecute never" feature, since we're dealing with an ARM binary.
In the iOS Security Guide, under "Runtime process security" we can read:
Further protection is provided by iOS using ARM’s Execute Never (XN) feature, which marks memory pages as non-executable.
Memory pages marked as both writable and executable can be used only by apps under tightly controlled conditions:
The kernel checks for the presence of the Apple-only dynamic code-signing entitlement. Even then, only a single mmap call can be made to request an executable and writable page, which is given a randomized address.
So, this section should never be flagged by MobSF, as long as Apple continues to use XN by default.
PIE
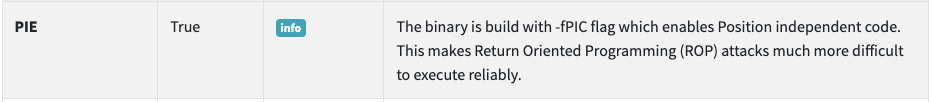
As explained above, each time you run a "Position Independent Executable" (PIE), the binary and all of its dependencies are loaded into random locations within virtual memory, which make ROP attacks much more difficult to execute reliably.
We can check for the presence of the PIE flag in our executable with otool:

Note the usage of otool's -h and -v options:
~ otool
	...
	-h print the mach header
	-v print verbosely (symbolically) when possible
If this flag is not present in the binary, then you need to review your compilation settings.
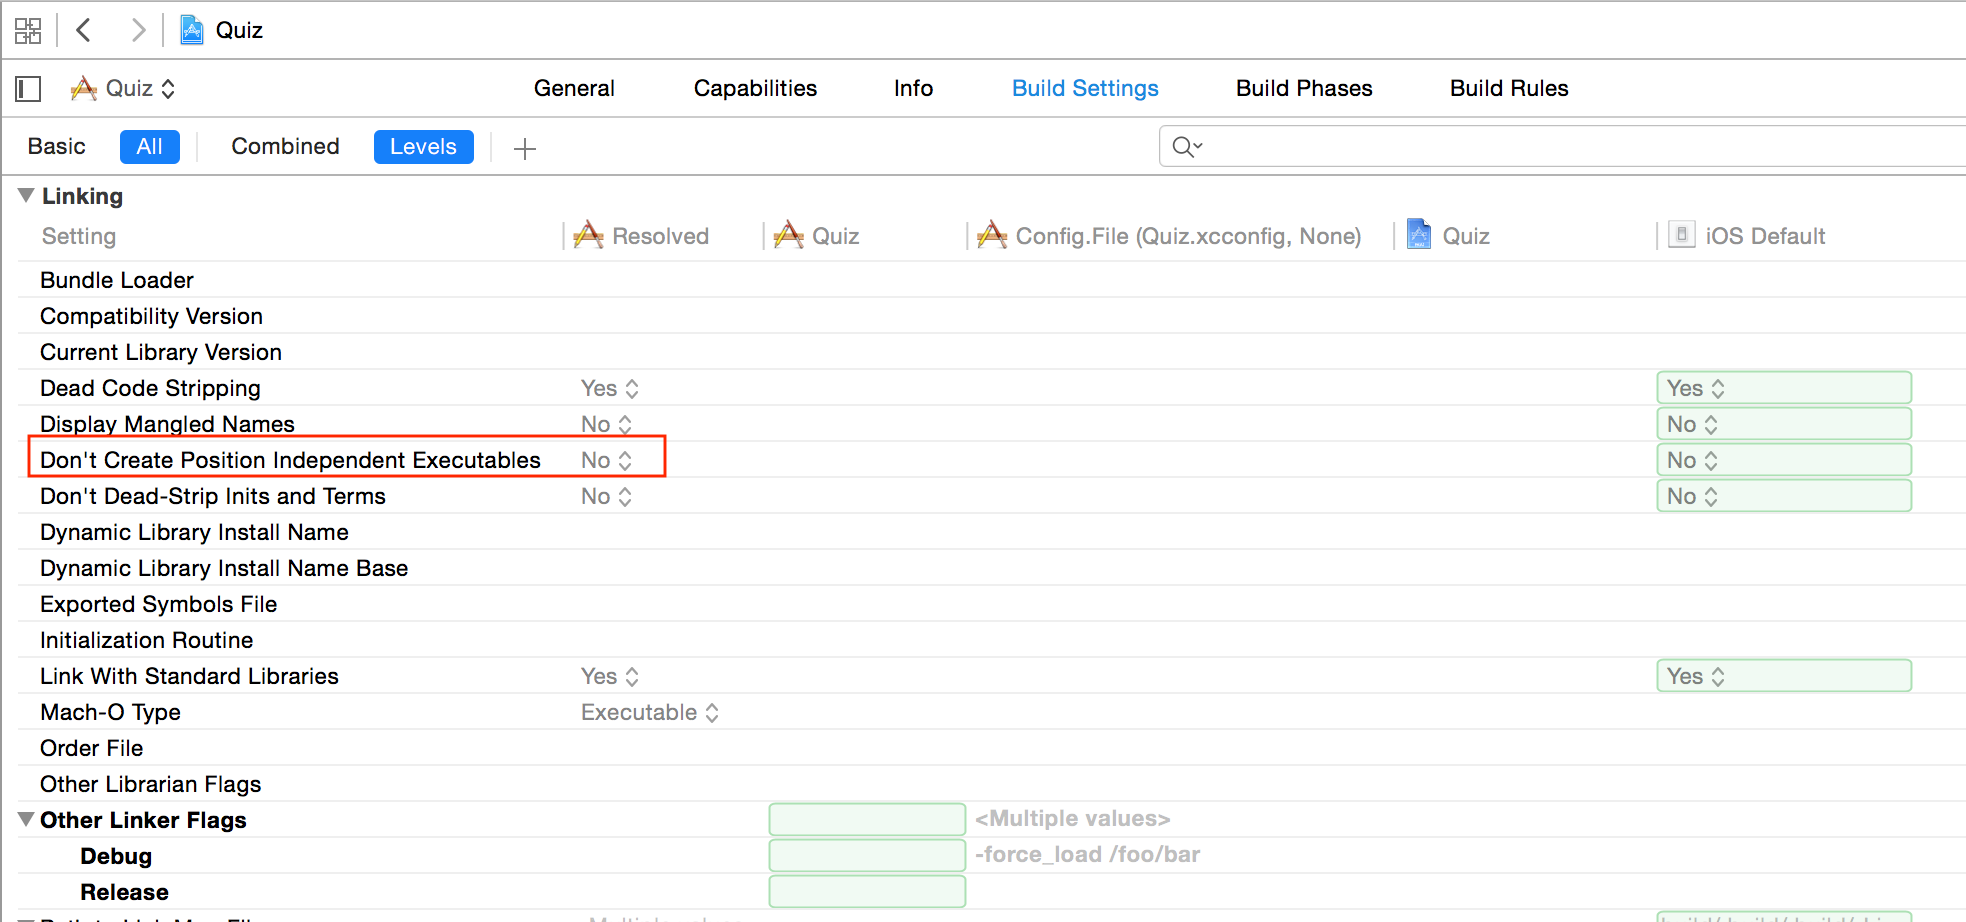
First, ensure that "Don't Create Position Independent Executables" under "Build Settings" is set to NO:
Then, check that these flags are set:
- In
Other C flags:-fPIC - In
Other Warning flags:-Wl,--emit-relocs(retains all relocations in the executable file) and-Wl,--warn-shared-textrel(warns if the text segment is not shareable).
Stack Canary
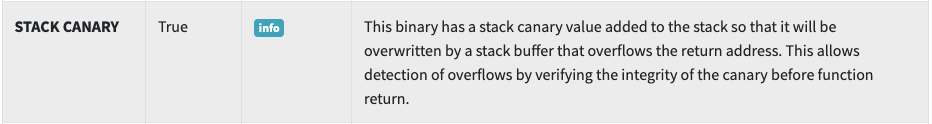
Again we can use otool to check whether a binary is using stack canaries by looking for some specific symbols, such as _stack_chk_guard and _stack_chk_fail:
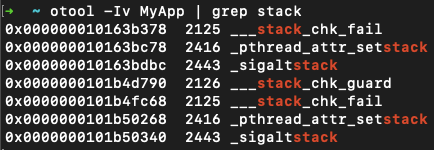
Note the usage of otool's -I and -v flags:
~ otool
...
-I print the indirect symbol table
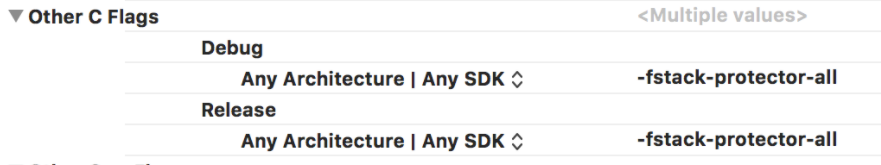
-v print verbosely (symbolically) when possibleIf the stack canary is not present, you need to ensure that the -fstack-protector-all flag is set under "Other C Flags", on your project's "Build Settings" tab, as shown below:
Rpath
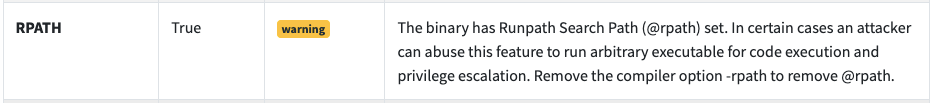
The "Runpath Search Path" instructs the dynamic linker to search for a dynamic library (dylib) on an ordered list of paths ... sort of like how Unix looks for binaries on $PATH.
This is an issue because it makes it possible for an attacker to place a malicious dylib in one of the first paths that doesn't contain the library that the linker is trying to locate, therefore hijacking it.
A simple way to check whether or not your application's libraries were compiled using rpath is to run otool with the -L flag, which lists all Mach-O Shared Libraries:
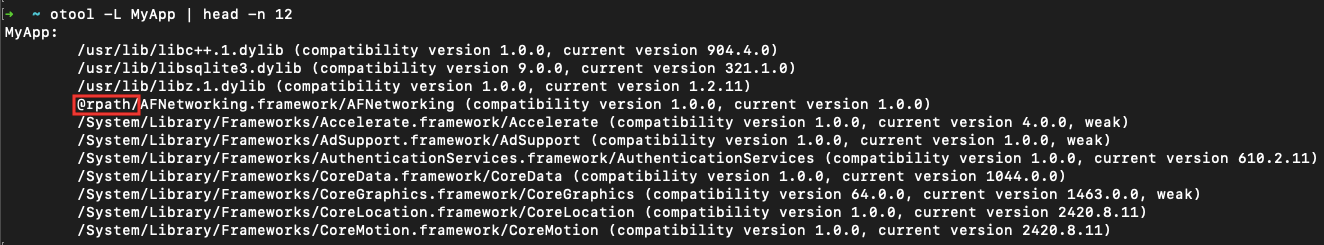
Note that some of the libraries are prefixed with @rpath, while others are prefixed by the absolute path.
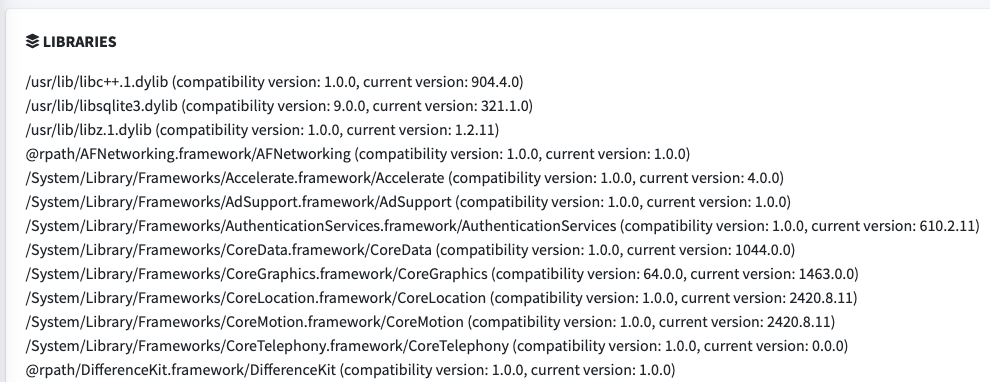
Also, if you already have access to the full MobSF Static Analysis report, you can simply scroll down to the "Libraries" section and check which are prefixed by @rpath:
If your application uses the Swift Package Manager, in order to compile the libraries without rpath you need to use some hidden build flags. On your local command line run:

Note the swift compiler option no-stdlib-rpath which disables rpath entries during compilation.
Configure your build settings so that the application is built with this configuration flag, e.g.: swift build -c release -Xswiftc -no-toolchain-stdlib-rpath.
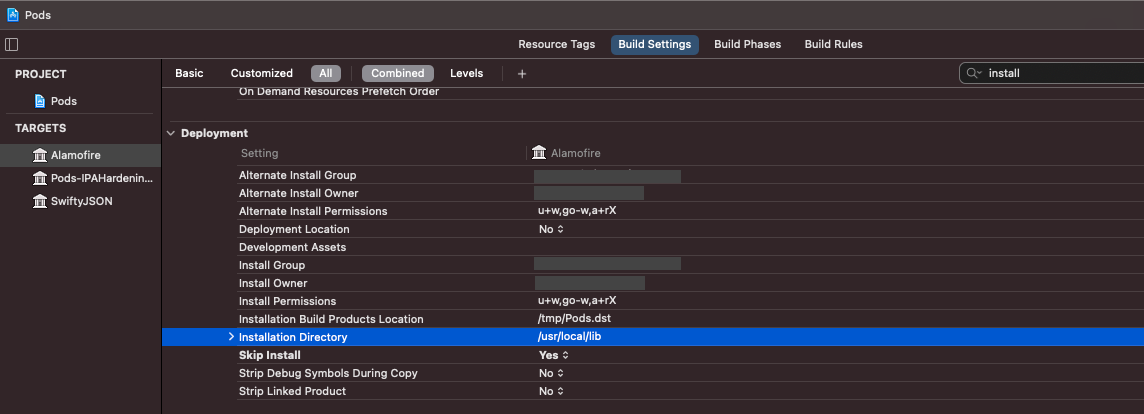
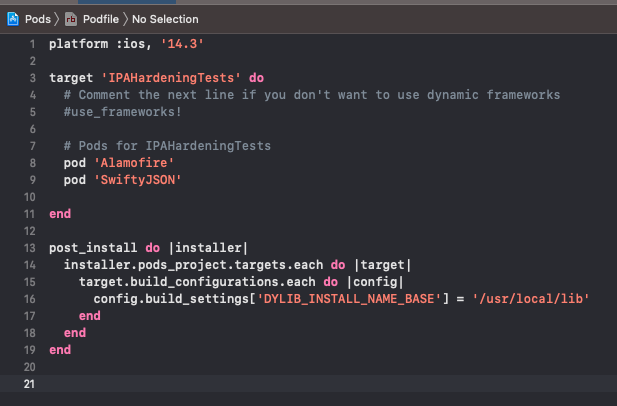
Alternatively, if your application uses Cocoapods, you can first check the install directory of the pods:
And then use the following configuration on your Podfile:
post_install do |installer|
  installer.pods_project.targets.each do |target|
    target.build_configurations.each do |config|
      config.build_settings['DYLIB_INSTALL_NAME_BASE'] = <your-install-directory>
    end
  end
end
So, the result would looks something like this:
Symbols Stripped
From Apple's Building Your App to Include Debugging Information:
When Xcode compiles your source code into machine code, it generates a list of symbols in your app—class names, global variables, and method and function names.
These symbols correspond to the file and line numbers where they’re defined; this association creates a debug symbol, so you can use the debugger in Xcode, or refer to line numbers reported by a crash report.
Debug builds of an app place the debug symbols inside the compiled binary file by default, while release builds of an app place the debug symbols in a companion Debug Symbol file (dSYM) to reduce the size of the distributed app.
So, the good thing about these dSYM files is that you can store them separately and then use them to symbolicate your logs without actually letting the end user have access to them via App Store:
~ symbolicatecrash "<path-to-crash-file>" "<path-to-dSYM file>" > symbolicated.crashBy default, dSYM files are generate for "Release" builds, which you can check by reviewing your "Build Settings":
Generate Debug Symbols=YESDebug Information Format=DWARF with dSYM File
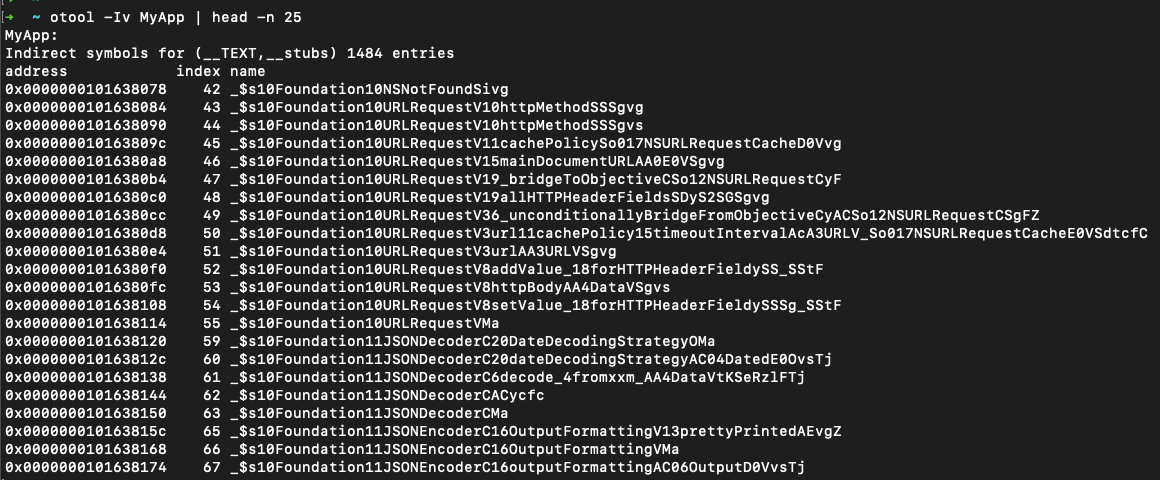
A simple way to check whether or not your application was compiled with debug symbols is to again run otool with the -Iv flags:
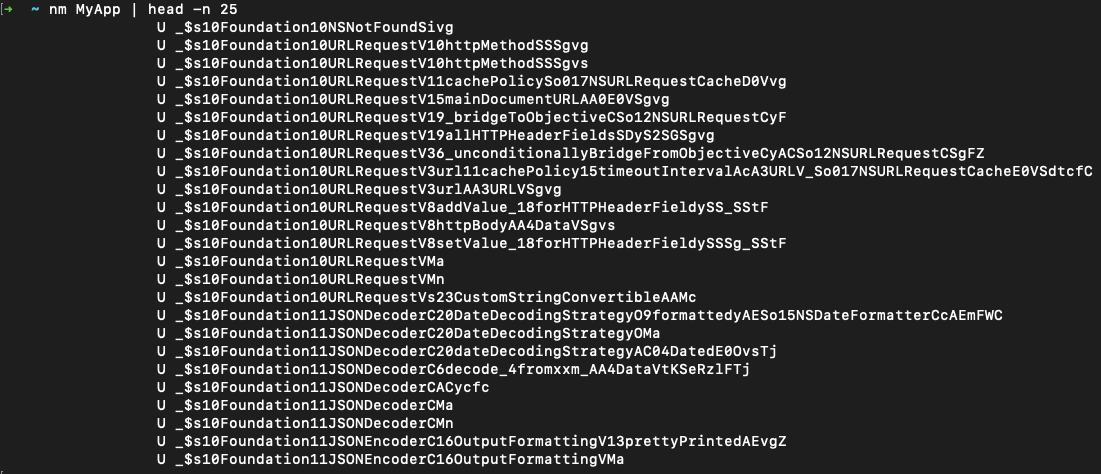
Alternatively, you can use nm, which "displays the name list (symbol table) of each object file in the argument list".
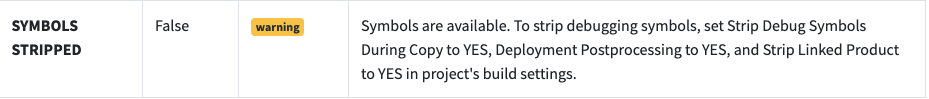
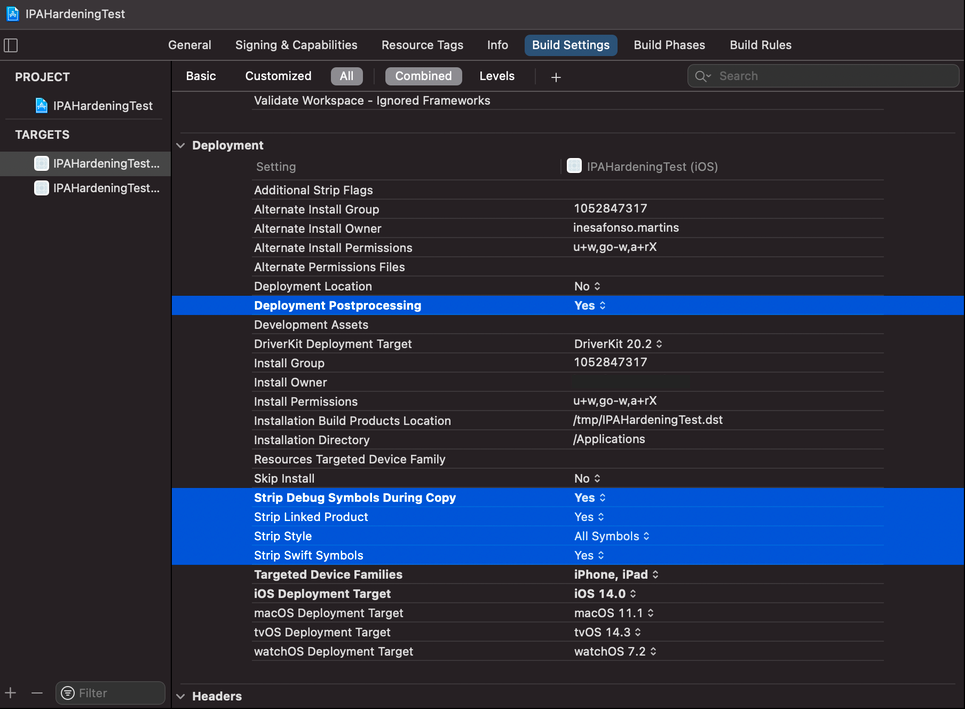
If MobSF flags you project as containing debug symbols, please ensure that your project's "Build Settings" contain the following "Release" configurations:
Deployment Postprocessing=YES;Strip Debug Symbols During Copy=YES;Strip Linked Product=YES;Strip Style=All Symbols;Strip Swift Symbols=YES
Finally, note that you can actually manually strip your binary, but as shown below, this invalidates the code signature:

Useful Links
- http://blog.dornea.nu/2014/10/29/howto-ios-apps-static-analysis/
- https://www.apple.com/mx/privacy/docs/iOS_Security_Guide_Oct_2014.pdf
- https://iphonedev.wiki/index.php/Crack_prevention
- https://blog.krzyzanowskim.com/2018/12/05/rpath-what/
- https://objective-see.com/blog/blog_0x46.html
- https://stackoverflow.com/questions/3656391/whats-the-dsym-and-how-to-use-it-ios-sdk